Enterprise solution

Economic Impact Reporting & Business Intelligence

Turn Insights Into Action: Economic Impact Reporting Tailored to Your Mission

Procurement is no longer merely a back-office function; it’s a catalyst for economic change. At NectariQ, our Economic Impact Reporting service is designed to help you quantify and communicate the real-world impact of your supplier spend. Whether your goal is to increase local sourcing, demonstrate economic inclusion, or achieve ESG-aligned outcomes, our data-driven approach provides visibility where it matters most.

We don’t just show you the numbers—we help you understand what they mean, how they compare, and where to take action next.
From Raw Data to Community Impact: Our Funnel-Based Methodology

Our proprietary funnel model turns supplier data into layered insights that inform procurement, finance, and supply chain leaders with practical data and executive summary strategies. Here’s how it works:

Top of funnel
Broad classification

Global and National comparisons of GDP, Revenue, Wages, Job creation, and factors that impact them over a specified period. We layer in forecast modeling and data comparison from several sources.

Mid funnel
Regional or Industry Specific Verified & Enriched

Our business analysis is validated against more than 10 national and international agencies. Industry-specific codes by country are scrutinized to ensure precise alignment. We customize our reports to clients’ regions, territories, and geographic footprints.

Bottom funnel
Client-specific spend

Data is then analyzed using NectariQ’s spend dashboard to provide insights when comparing it against national and regional data points. Each report includes an executive summary, insights, and clearly defined indicators for strategic business engagement.

This approach ensures your economic impact report is not only measurable but meaningful.

Powered by Expertise. Guided by Analysts. Built for Action.

Our in-house Business Analysts are the secret weapon behind each Economic Impact Report. With decades of combined experience in procurement strategy, ESG analysis, and regional development, our team:

  • Consults with your stakeholders to understand KPIs and reporting outcomes
  • Tailors each impact study to align with your community reinvestment or sustainability goals
  • Provides actionable summaries that executive teams, councils, or boards can immediately use

Whether it’s to support supplier strategy sessions, stakeholder presentations, or compliance reporting, our analysts ensure your impact isn’t just measured—it’s understood.

What your report includes
Economic impact dashboard

Visualize supplier distribution, spend allocation, and regional penetration

Equity and certification maps

Real-time analysis of MBE, WBE, Veteran-Owned, 8a, and other supplier types

Spend trends

View direct and indirect spend over time, including Tier I & Tier II breakdowns

Localized impact snapshots

Quantify economic inclusion efforts across cities, counties, and districts

Customizable Dashboards. Industry-Specific Reporting. Regionally Tuned Results.

Whether you’re a global enterprise, regional utility provider, or public sector agency, our internal Business Analyst team configures each report to your exact needs:

Client-specific
Your fiscal year, your filters

Custom fiscal year alignment, filters by department, supplier tier, or internal program.

Region-specific
Down to the municipality

Breakdowns by municipality, state, economic zone or global territory.

Industry-specific
Classifications by vertical

Typical supplier classifications for energy, construction, retail, public health, transportation and more.

IMPLAN methodology
Direct, indirect, induced

This is more of a forecast based on older historical data, including Direct, Indirect, and Induced data.

We seamlessly integrate with your systems and structure reporting to reflect how you measure ROI, spend, jobs created, certifications, or capacity within the community you serve.

Sample report

Harvesting Growth From Farm to Fork — The Grocery Retail Economic Landscape Report

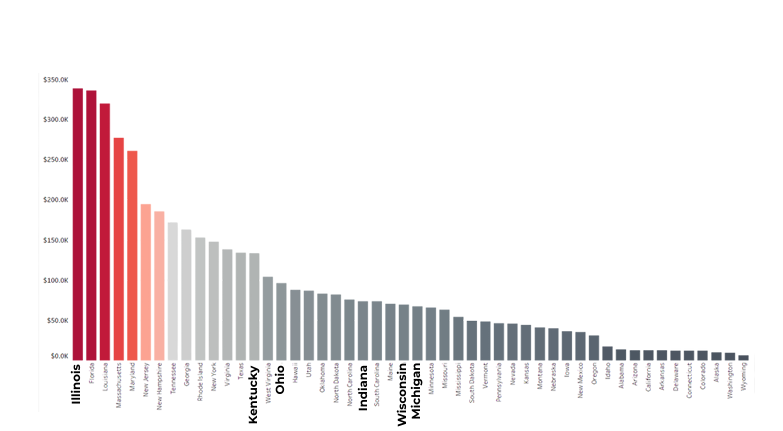
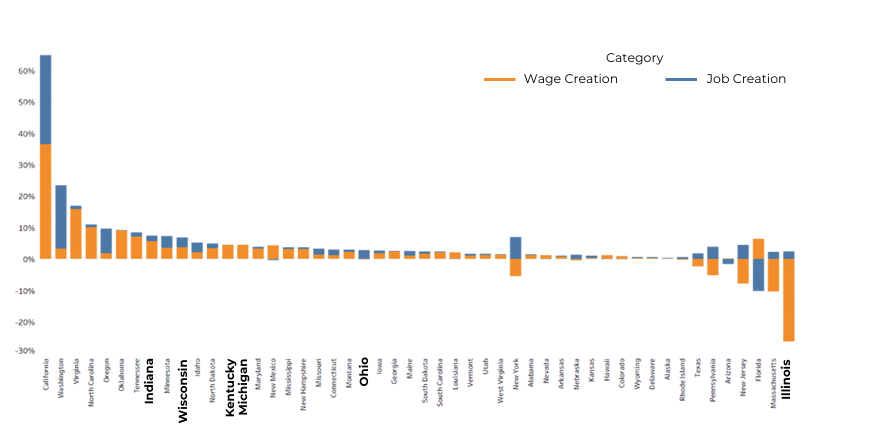
An excerpt from a real NectariQ Economic Impact Report. These charts compare job and wage creation across states — Production Sector, Economic Indicators Insights Statewide [2022–2024] — the same indicators your own report draws on to show where supplier spend creates measurable economic impact.

Job creation vs. wage creation
Percentage contribution to total
Percentage Contribution to Total Job Creation vs. Wage Creation
Average wage creation by state
Production sector, 2022–2024
Average Wage Creation by State
Request a report

Data-Driven Procurement Power

With our tailored economic impact reporting, discover the measurable ROI of your certified suppliers, local engagement, and inclusive economic growth.

✓
Measurable ROI on your certified supplier spend
✓
Local engagement quantified, not estimated
✓
Executive summary your board can use the same day
Interested in Economic Impact Report?

Please fill out the form below to receive a detail report.

Schedule Your Demo Today

Ready to enhance your vendor management? Schedule a free demo with our team to see how NectariQ can support your business. Our software provides powerful tools to streamline supplier management and ensure seamless operations. Take the first step toward optimizing your vendor relationships today.